

LCIA Calculation & Results
This page covers the two common LCIA usage patterns in TianGong LCA:
- Viewing LCIA results directly inside a process or model
- Moving to the dedicated Process Analysis Workspace when you need comparison, grouping, or contribution-path analysis
What LCIA means here
LCIA converts life cycle inventory results into impact-category results such as climate change, acidification, or ozone depletion.
The platform currently supports both:
- Process-level LCIA results
- Model-level LCIA results
Both are useful for direct inspection. For cross-process comparison or path tracing, use the separate analysis workspace.
Before you run LCIA
Confirm the following first:
- The process or model has complete input/output modelling
- A reference flow or functional unit has been defined correctly
- You are reusing the platform's standard flow properties, unit groups, and elementary flows where possible
- The selected impact method actually contains matching characterisation factors
Heavy use of custom units, custom flow properties, or non-standard elementary flows can lead to missing results or incorrect magnitudes.
Process-level LCIA
Process-level entry point
Open a process in My Data → Processes and use the LCIA results area in the process editor or viewer.
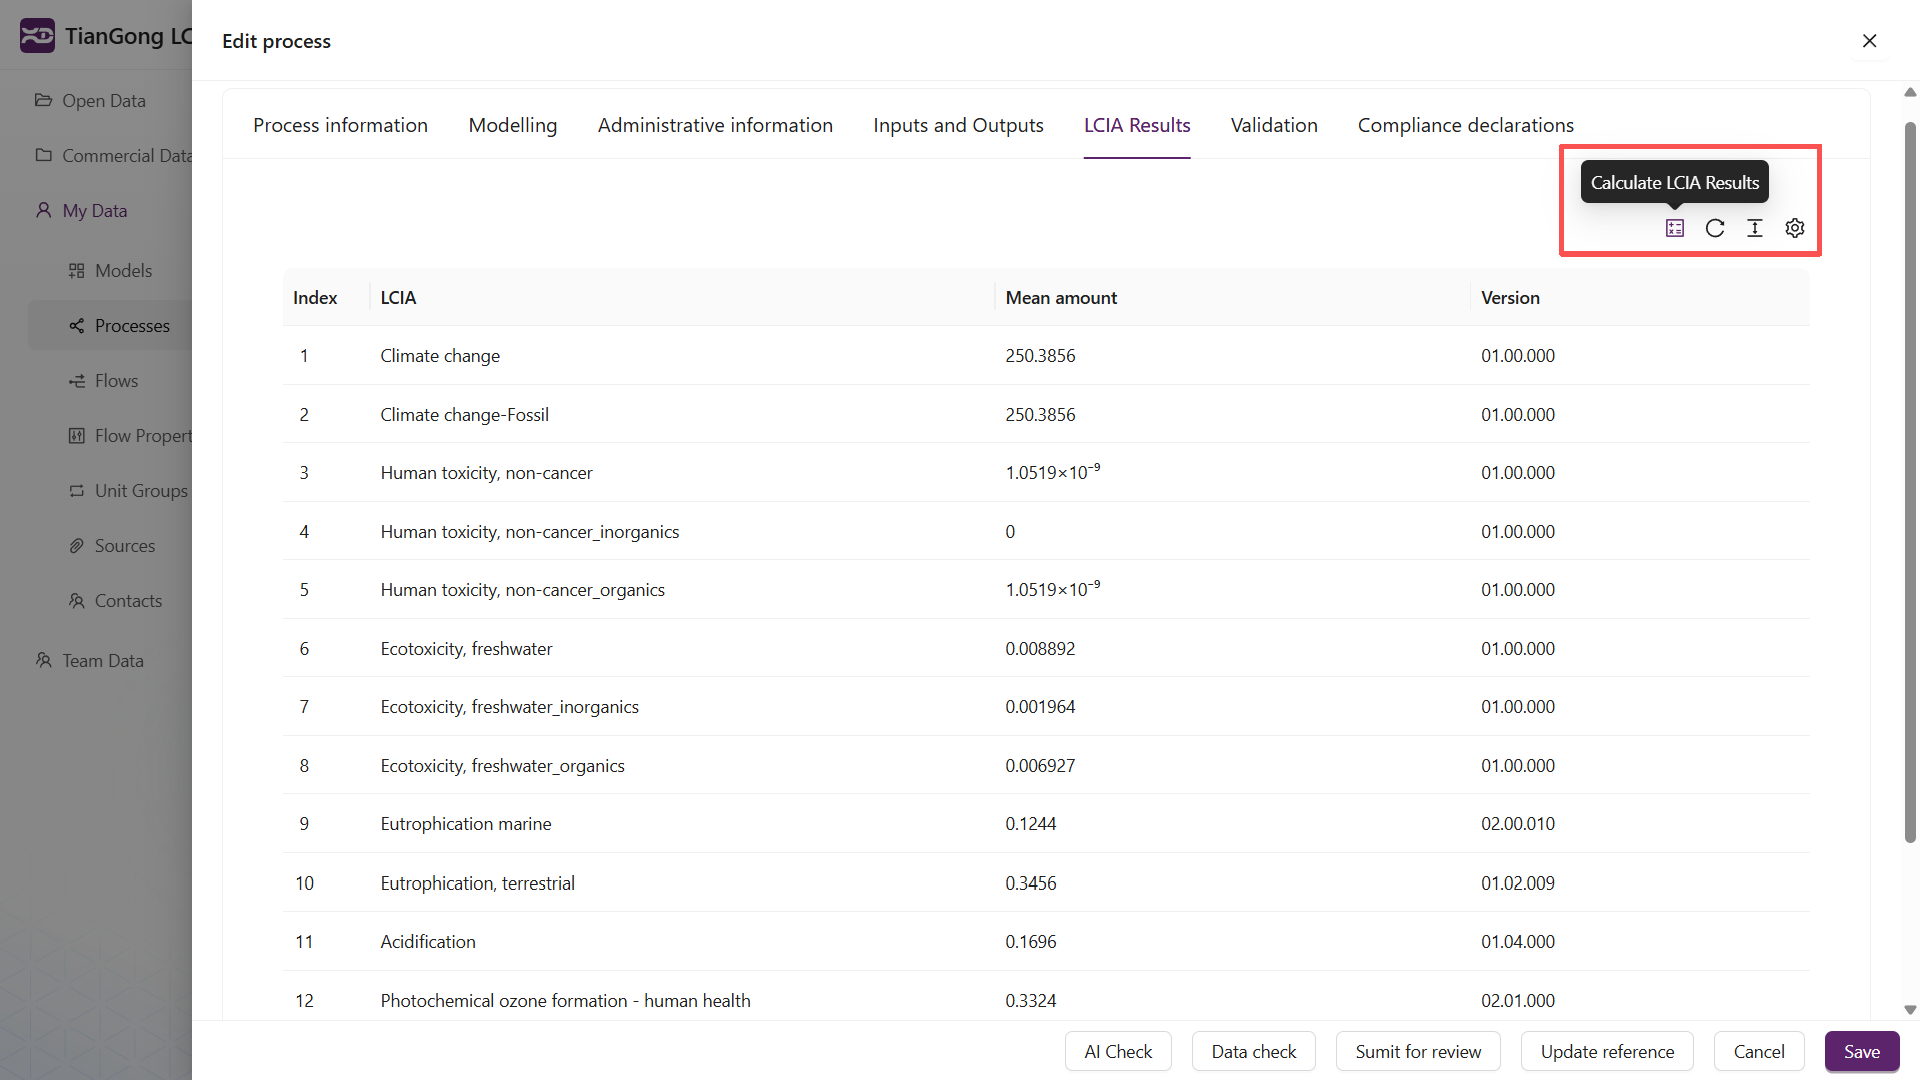
Process-level best use cases
- Quickly checking the impact profile of one process
- Spotting abnormal impact categories during authoring
- Performing a single-process sanity check
Important limitation
Process-level LCIA mainly reflects the elementary-flow impacts associated with that process.
That means:
- It is useful for one process at a time
- It is not the same as a full product-system total
- It should not replace multi-process comparison or contribution-path analysis
- When you view process LCIA in the Open Data scope, the page prefers published LCIA result
sets. These result sets are generated, previewed, and published from the Data Processing
workspace by
data_product_managerusers, and include only inputs that satisfy published-state eligibility rules. If the related result set has not been published, is empty, or is temporarily unavailable, the page shows the corresponding empty or unavailable state. - If the process has a current Model / Result Release, the process viewer can also show release version, readback status, validation items, manifest hashes, and downloadable ZIPs. When you download the Calculation Bundle or a sidecar artifact, the page refreshes secure links and verifies byte size plus SHA-256 before saving; expired links or changed artifact metadata prompt you to refresh secure links or reload. Legacy LCIA-only results remain separate; they are not automatically the same as a Calculation Bundle or model-result release.
Model-level LCIA
Model-level entry point
Open a model in My Data → Models and use the LCIA results area in the model result workspace.
Model-level best use cases
- Reviewing full product-system impacts
- Comparing alternative model setups
- Checking whether a solved model behaves as expected
Compared with process-level LCIA
| Scenario | Better entry point |
|---|---|
| Inspect one process | Process-level LCIA |
| Inspect the full system | Model-level LCIA |
| Compare multiple processes | Process Analysis Workspace |
| Trace contribution paths | Process Analysis Workspace |
When to move to Process Analysis
If your task is any of the following, the LCIA result panel is no longer enough:
- Impact comparison across multiple processes
- Grouped analysis by location, classification, dataset type, or team
- Contribution path exploration from a root process
- Switching between Current user data, Open data, and All data
In those cases, go directly to Process Analysis Workspace.
Troubleshooting
Why are some impact categories missing?
Check:
- Whether flows are linked to the correct standard flow properties
- Whether unit conversions are valid
- Whether the selected impact method contains matching factors
The result panel also verifies the LCIA method bundle, solver snapshot evidence, and characterisation-factor coverage. A missing factor is shown as incomplete coverage, not as zero impact. If the method-bundle hash, source snapshot, method identity, or evidence version does not match, the page shows an untrusted or source-mismatch notice instead of continuing to display a numeric result. When gap evidence is shown, inspect the missing flow, direction, and impact method before deciding whether to add elementary-flow mappings or change the analysis scope.
Why do the result magnitudes look wrong?
Common causes include:
- Incorrect unit conversion
- Custom unit groups or flow properties that do not align with platform defaults
- An incorrect reference flow or functional unit
- A product input exchange
exchange.locationpoints to a different supply region, or process annual supply / production volume changes the provider shares across multiple providers - If the consumer process and an eligible reference-output provider for the
product flow share the same
model_id, the system first uses that same-model provider subset before geography-tier selection and annual-volume weighting. Providers from another model do not enter that input's supply mix only because they are geographically closer or have a larger annual volume - Missing, invalid, or non-positive annual volume uses a default positive weight. When investigating, check snapshot coverage and provider-linking diagnostics for fallback counts and supply-region sources
- Automatic provider linking treats only a quantitative reference output as an
eligible provider for that product flow. Same-
flow_idnon-reference outputs are recorded only as diagnostic candidates and do not automatically enter the supply mix. If diagnostics reportrejected_non_reference_only, repair the reference output, add provider data, or model the market / co-product process explicitly before recalculating.
Why should I use Process Analysis instead?
If you have moved beyond reading one result and now need comparison, grouping, or tracing, continue with Process Analysis Workspace.
Process Analysis Workspace
Explain the LCA Analysis workspace in My Data → Processes, including profile, comparison, grouped results, and contribution-path analysis.
Permissions & Data Spaces
Consolidate the main access boundaries for Open Data, Commercial Data, My Data, Team Data, review roles, and system roles.